You make $110,000 a year. So why does it feel like you’re always broke?
Introduction:
You’re sitting at your kitchen table on a Tuesday night. Laptop open. Calculator app on your phone. A stack of papers spread out in front of you—property tax bill, health insurance statement, daycare invoice, student loan payment confirmation.
Your spouse is doing dishes in the background, and you’re trying to figure out where the hell all the money goes.
You make $110,000 combined. Six figures. That used to mean something, right? That used to mean comfortable.
So why does it feel like you’re one car repair away from putting groceries on a credit card?
You run the numbers again. Then a third time, because they can’t possibly be right.
But they are.
Before you’ve bought a single thing you actually want—before you’ve taken a vacation or saved for retirement or done anything except exist—you’ve already given up over $33,000.
And that’s just the beginning.
Meet the Andersons: An American Family Doing Everything “Right”

Let me introduce you to Mike and Sarah Anderson.
Sarah is a marketing manager making $62,000 a year. Mike works in IT, earning $48,000. Their combined household income of $110,000 puts them in the 66th percentile of American households—meaning they earn more than two-thirds of all families in the country.
They have two kids, ages four and seven. They own a modest three-bedroom house in a decent school district.
They did everything right. Got the degrees. Got the jobs. Got married. Bought the house.
They’re living the dream.
Except they’re not sleeping at night.
January: The Paycheck Shock
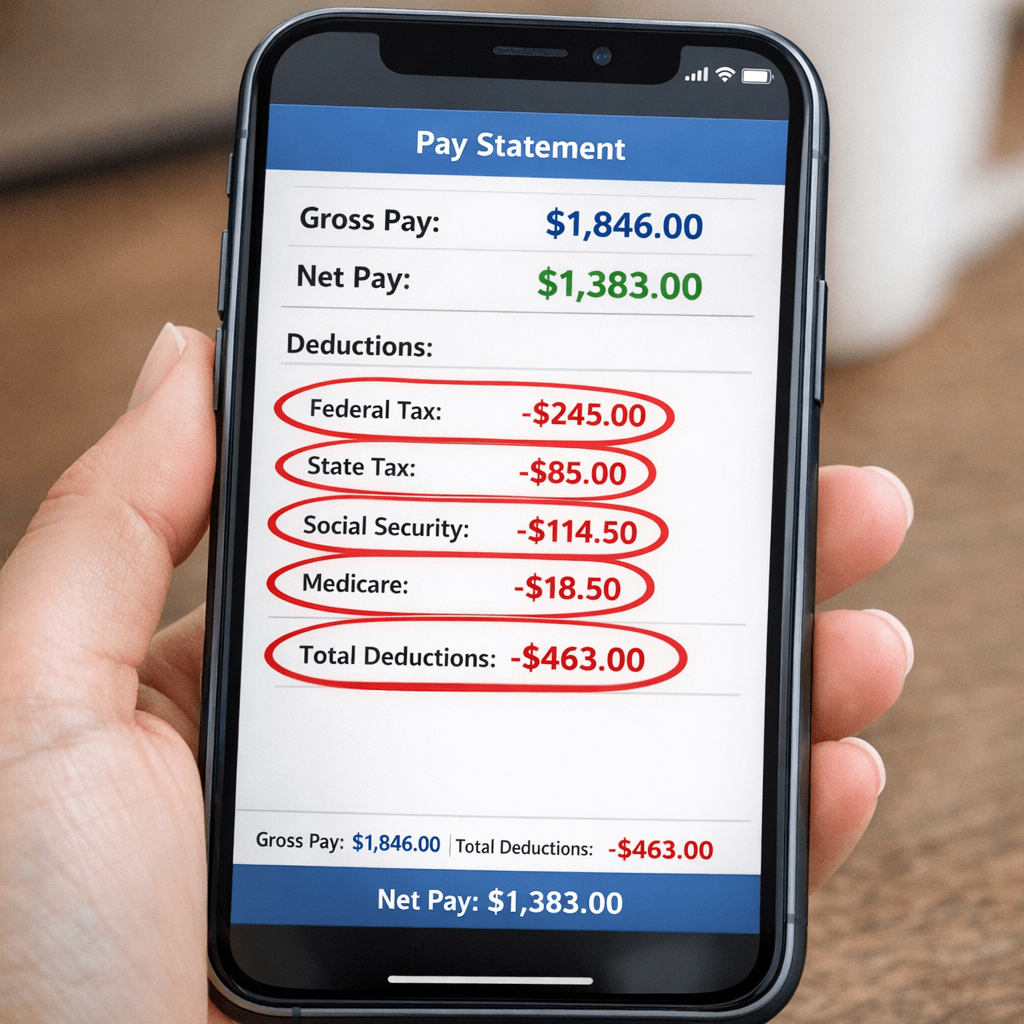
It’s January 2nd. Mike’s looking at his first paycheck of the year.
His gross pay for two weeks is $1,846. He’s expecting about $1,500 to hit the checking account.
Instead, he sees $1,383.
He stares at the pay stub:
- Federal income tax: $147
- Social Security: $114
- Medicare: $27
- State income tax: $85
- Health insurance premium: $264
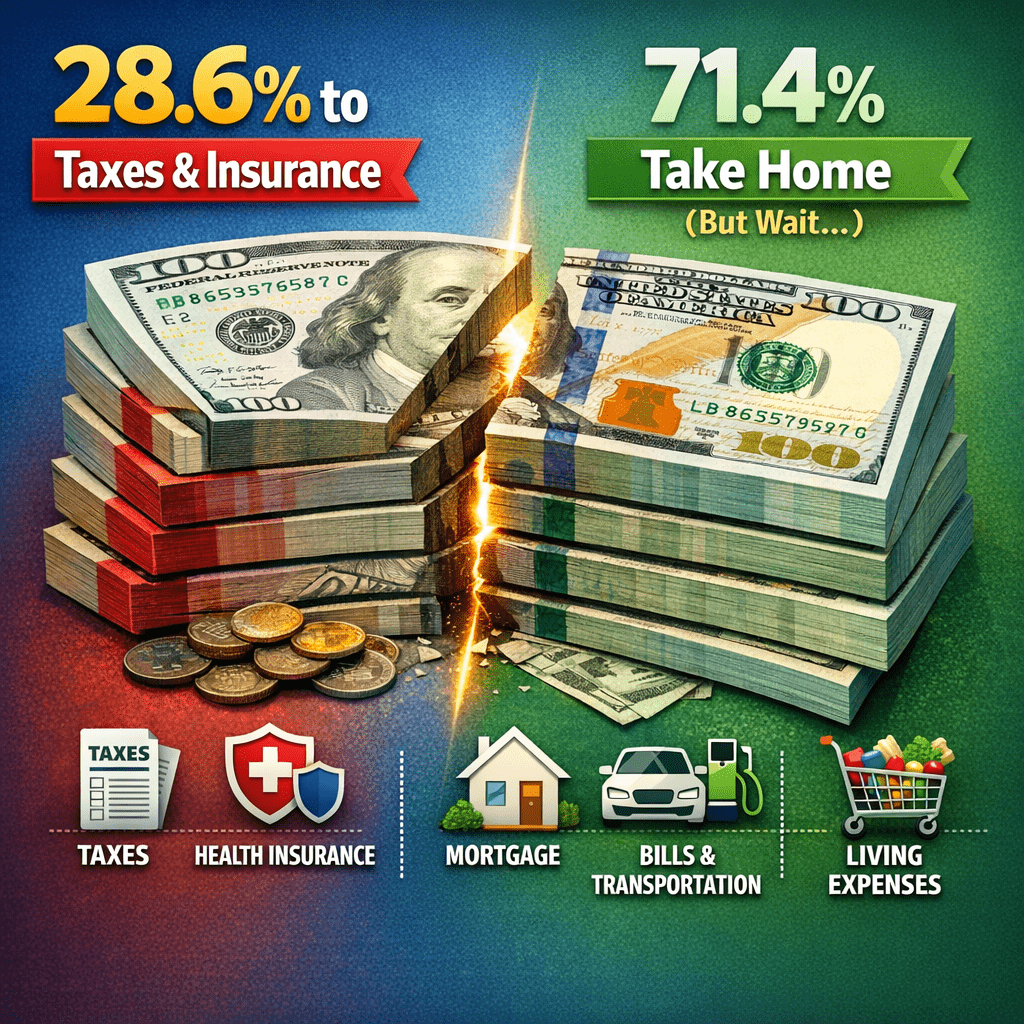
Before he’s even seen the money, $528 disappeared. That’s 28.6% gone before it reaches his account.
And this happens every two weeks. Twenty-six times per year.
Sarah’s paycheck tells the same story. Her gross bi-weekly pay of $2,385 becomes $1,764 after deductions take their cut—$748 gone per paycheck, or 31.4%.
Combined, they bring home about $81,822 per year after payroll taxes and health premiums.
Not $110,000. Not even close.
But that’s just the money you can see disappearing. That’s just the taxes that show up on a pay stub.
The Paycheck Breakdown: Where Every Dollar Goes
February: The Property Tax Bill Arrives
$4,300 for the year, due in two installments.
Sarah opens the envelope at the kitchen table and just stares at it. That’s $358 per month they need to set aside.
Their mortgage payment is $2,100. Add the property tax, and they’re at $2,458 per month just to keep the house.
That’s 36% of their take-home pay—before they’ve turned on a light or flushed a toilet.
March: Tax Season Reality Check
They use TurboTax because hiring an accountant costs $400, and they’re trying to save money.
Mike plugs in the numbers and watches their federal tax bill calculate in real time. After the standard deduction, their gross federal tax comes to $8,943.
But then TurboTax asks about the kids. Two children under 17 means they qualify for the child tax credit—$2,000 per kid, $4,000 total.
Mike watches the number drop to $4,943.
They’ve been withholding $8,814 through payroll all year (HR messed up their W-4s), so now they’re getting a $3,871 refund.
For about 45 seconds, Mike feels like they won something.
Then he remembers the credit card balance from January—when they had to put groceries on plastic because the heating bill was $340 that month. That balance has been sitting at $1,847, accruing 19.99% interest for three months.
The refund is gone in 48 hours:
- Pay off credit card: $1,847
- Move to savings: $1,500 (bringing their emergency fund to a whopping $2,700)
- Kids’ shoes and clothes: $524 (the 7-year-old has grown 3 inches, and the 4-year-old keeps destroying pants)
They also get $220 back from the state. They use it to pay down the water bill that’s two months behind.
The Real Numbers Nobody Wants to Talk About
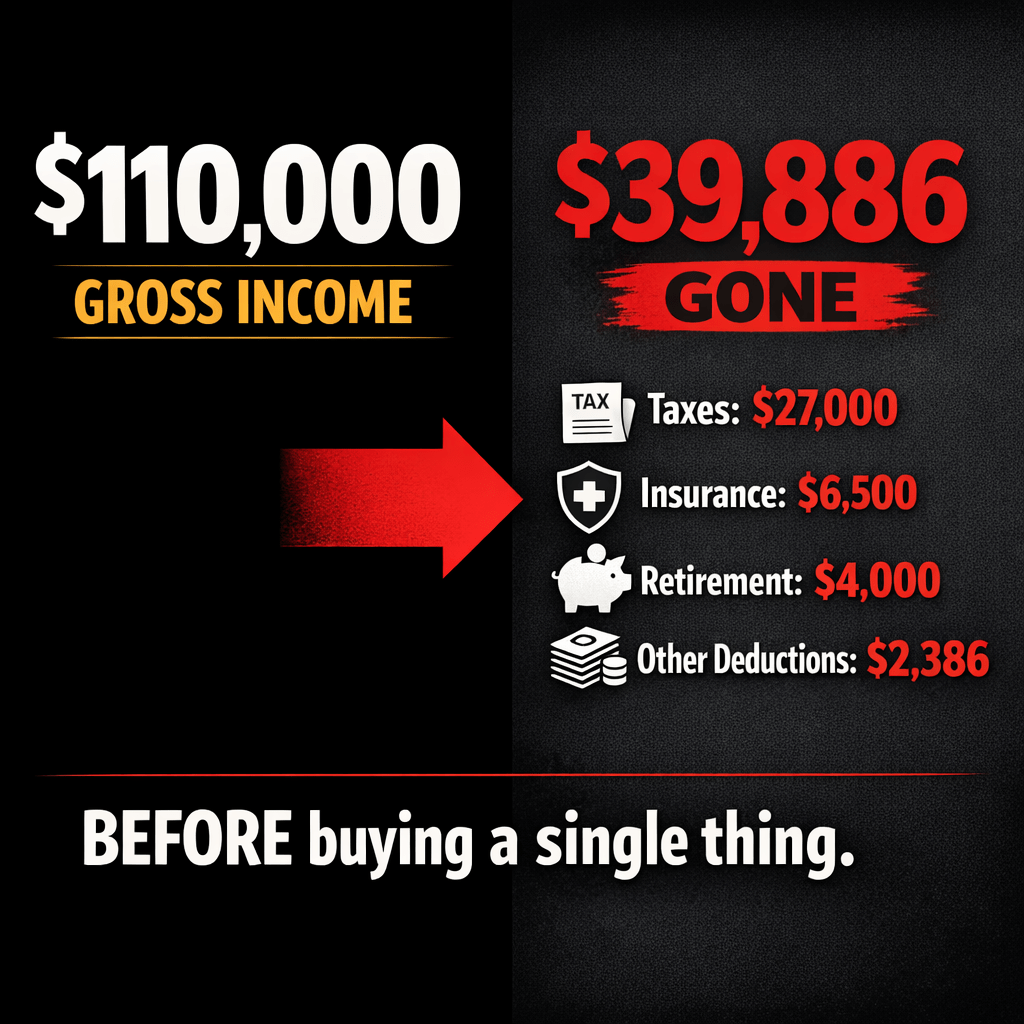
Mike adds everything up:
| Category | Annual Cost |
|---|---|
| Federal income tax | $8,943 |
| State income tax | $4,500 |
| FICA (Social Security & Medicare) | $8,415 |
| Property tax | $4,300 |
| Health insurance premiums | $13,728 |
| TOTAL | $39,886 |
That’s $39,886 before they’ve lived a single day of their lives.
He closes the laptop. Sarah asks him what’s wrong.
He says, “Nothing.”
But he’s just realized they’ve given up 36.3% of their gross income, and they haven’t bought food yet.
April: The Childcare Bill

Both kids are in full-time care because both parents work full-time.
- 4-year-old (full daycare): $1,250/month
- 7-year-old (after-school care): $600/month
That’s $1,850 per month. $22,200 per year.
Sarah does the math in her head while writing the check.
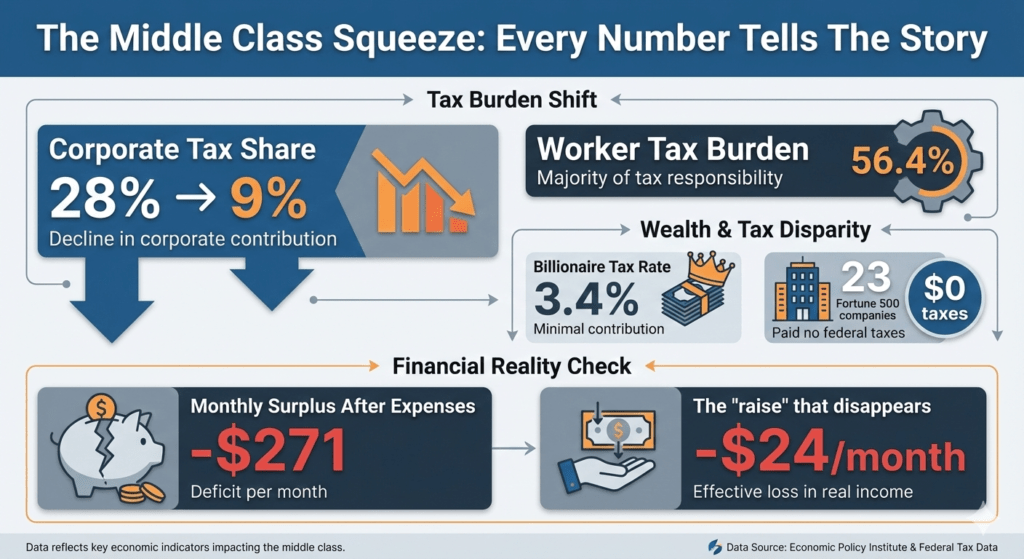
They’re now at $62,086 consumed by taxes and childcare. That’s 56.4% of their gross income.
Their take-home after everything is about $47,914 for a family of four.
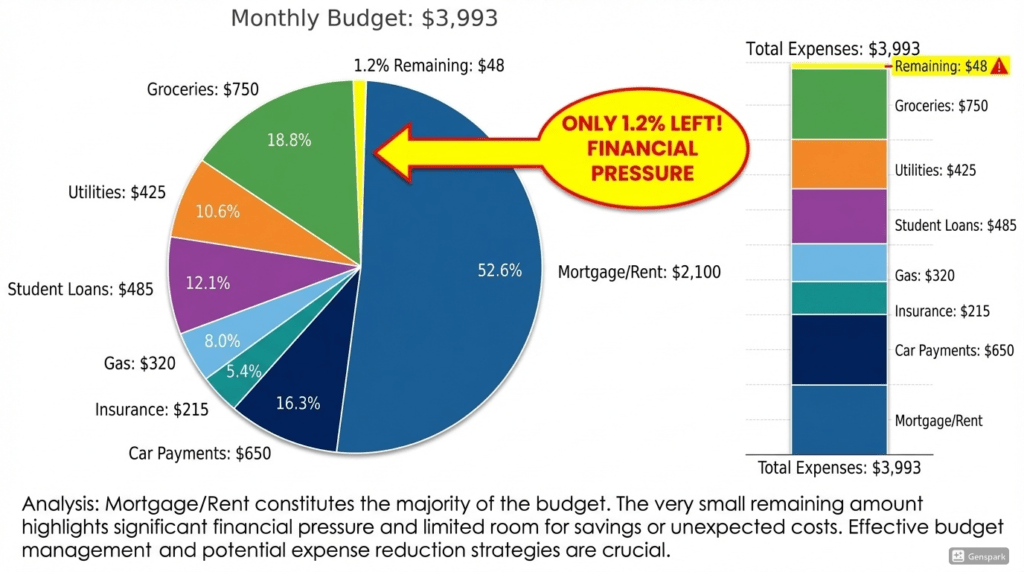
That’s $3,993 per month to cover mortgage, utilities, food, gas, car payments, student loans, and everything else humans need to survive.
The Monthly Budget Breakdown
Here’s where it gets really fun.
The mortgage is $2,100. That leaves $1,893 for everything else.
| Expense | Monthly Cost |
|---|---|
| Two car payments (both commute) | $650 |
| Car insurance (two vehicles) | $215 |
| Gas | $320 |
| Student loans | $485 |
| Utilities (electric, water, gas, internet, phones) | $425 |
| Groceries (family of four, eating carefully) | $750 |
| TOTAL | $2,845 |
They’ve got $48 left per month.
Forty-eight dollars for:
- Clothing
- Birthday presents for the kids’ friends
- Field trip permission slips ($25 each)
- Car registration ($180/year)
- Maybe leaving the house occasionally and pretending they have a life
The Invisible Taxes Nobody Mentions
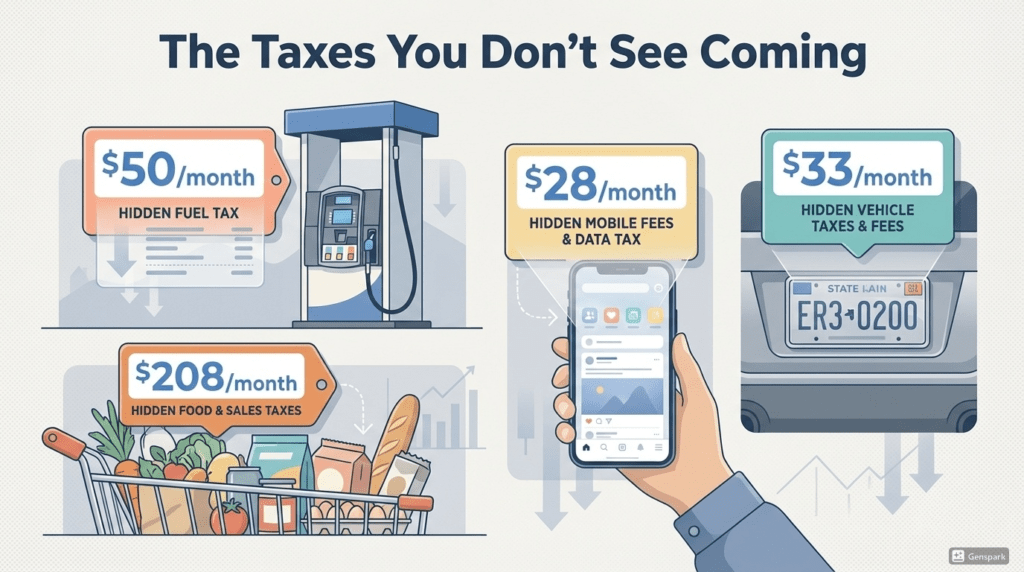
And we haven’t talked about the hidden taxes yet.
| Hidden Cost | Monthly Amount |
|---|---|
| Gas taxes (53¢/gallon federal + state) | $50 |
| Cell phone taxes and fees | $28 |
| Vehicle registration ($200/car/year) | $33 |
| Sales tax (7.5% on purchases) | $208 |
| TOTAL | $319 |
Take that $48 surplus and subtract $319 in additional taxes and fees.
They’re $271 in the red every single month—before anything unexpected happens.
And something always happens.
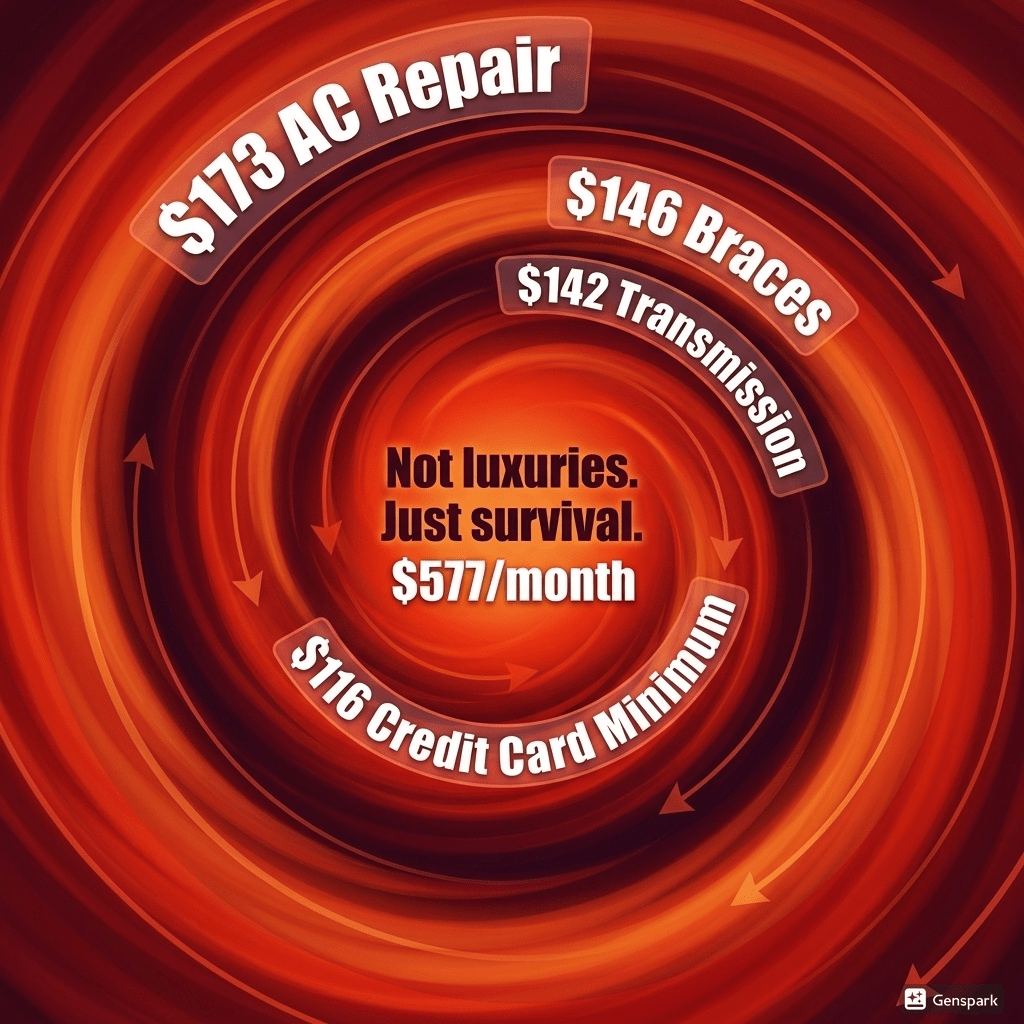
When Life Falls Apart: A Timeline
June: The AC Dies
It’s 94 degrees. The repair quote is $3,800. They don’t have $3,800. They have $1,200 in savings.
They finance the repair at 9.99% APR over 24 months. Another $173/month.
August: Braces
The 7-year-old needs braces. The orthodontist wants $5,000. Insurance covers $1,500.
They finance the remaining $3,500. Another $146/month for 2 years.
Sarah cries in the car after the appointment. Not because of the braces—because she just realized they’re paying $319/month for an air conditioner and teeth.
And they still don’t have an emergency fund.
September: Tires
Mike’s car needs new tires. All four are bald. $720 goes on the credit card.
They’ll pay the minimum and figure it out later.
Later never comes.
October: The Transmission
Sarah’s car starts making a noise. The transmission is failing.
- Rebuild: $4,200
- Replace: $6,800
- Car’s value: ~$8,000
They take out a personal loan at 11.5% APR for $4,500. Another $142/month for 3 years.
Monthly debt payments for things that broke:
- Air conditioner: $173
- Braces: $146
- Transmission: $142
- Total: $461/month
That’s $461 per month for things that broke—not things they wanted, things that broke!.
November: Mom Needs Help
Mike’s mom is 67, still working part-time because Social Security doesn’t cover her expenses. She needs help with a $1,200 medical bill that insurance denied.
They have $900 in savings. But she’s his mom.
It goes on the credit card. Balance: $3,840 at 19.99% APR.
At that rate, they’re basically just paying interest forever.
The Debt Spiral: Paying for Things That Broke
This Is Middle-Class Life in America
The Andersons aren’t irresponsible. They’re not buying jet skis. They’re not taking European vacations.
They’re trying to keep their kids alive and their house from falling apart.
And they’re losing.
You’re not building wealth. You’re not getting ahead. You’re playing financial whack-a-mole—every time you think you’ve got things under control, something else breaks and you’re right back in the hole.
How Did We Get Here?
It didn’t use to be this way.
The Corporate Tax Shift
| Era | Corporate Share of Federal Revenue |
|---|---|
| 1950s | 28-33% |
| Today | ~9% |
Someone had to make up that difference. That someone was the Andersons.
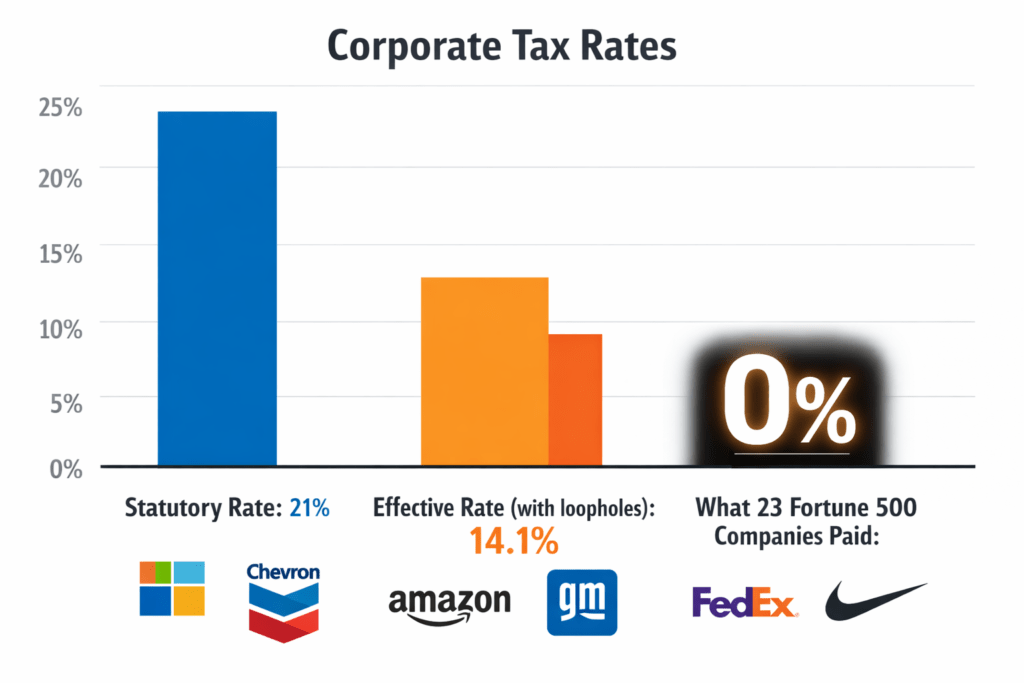
The corporate tax rate used to be 52%. After the 2017 Tax Cuts and Jobs Act, it dropped to 21%. But the effective rate—what corporations actually pay after loopholes—averaged just 14.1% between 2018 and 2022.
23 Fortune 500 companies, including Nike and FedEx, paid zero federal income tax for five straight years—despite being profitable every single year.
In 2020, 55 profitable corporations paid nothing on $79 billion in profits. If they’d paid the statutory rate, they’d have owed $16.4 billion. Instead, they got $4.3 billion in refunds. The government paid them.
The Tax Rate Reality: What Corporations Actually Pay
The Payroll Tax Squeeze
Meanwhile, payroll taxes went from funding less than 15% of federal revenue in the 1950s to 33% today.
The combined Social Security and Medicare rate increased 59% since 1970—while corporate rates dropped 60%.
The FICA Scam
Here’s the kicker: Social Security tax only applies to the first $176,100 in wages.
- Mike and Sarah pay 6.2% on every dollar they earn
- Someone making $500,000 pays 6.2% on the first $176,100, then zero on the remaining $323,900
- Their effective rate drops to just 2.2%
The Andersons pay nearly three times the rate (as a percentage of income) compared to someone making half a million.
Capital Gains: The Rich Person’s Tax Code
If you work for your money (like Mike and Sarah), you pay income tax plus FICA.
If you make money from investments, you pay less—and no FICA.
75.4% of all capital gains go to the top 1%.
This isn’t a tax system. It’s a machine designed to extract maximum value from people who work for a living.
The American Lie: “We’re Lightly Taxed”
Politicians love pointing out that the US tax-to-GDP ratio is 25.6%—nearly 9 points below the average for developed nations.
But here’s what they don’t mention:
Other countries bundle healthcare, childcare, education, and parental leave into their taxes and provide them as services.
Americans pay for all of that separately—at prices that make no sense.
What Americans Pay vs. What They Get
| Category | Andersons (US) | German Family |
|---|---|---|
| Taxes + mandatory costs | 56.4% of income | ~48% of income |
| Healthcare | $13,728/year + out-of-pocket | Universal (included) |
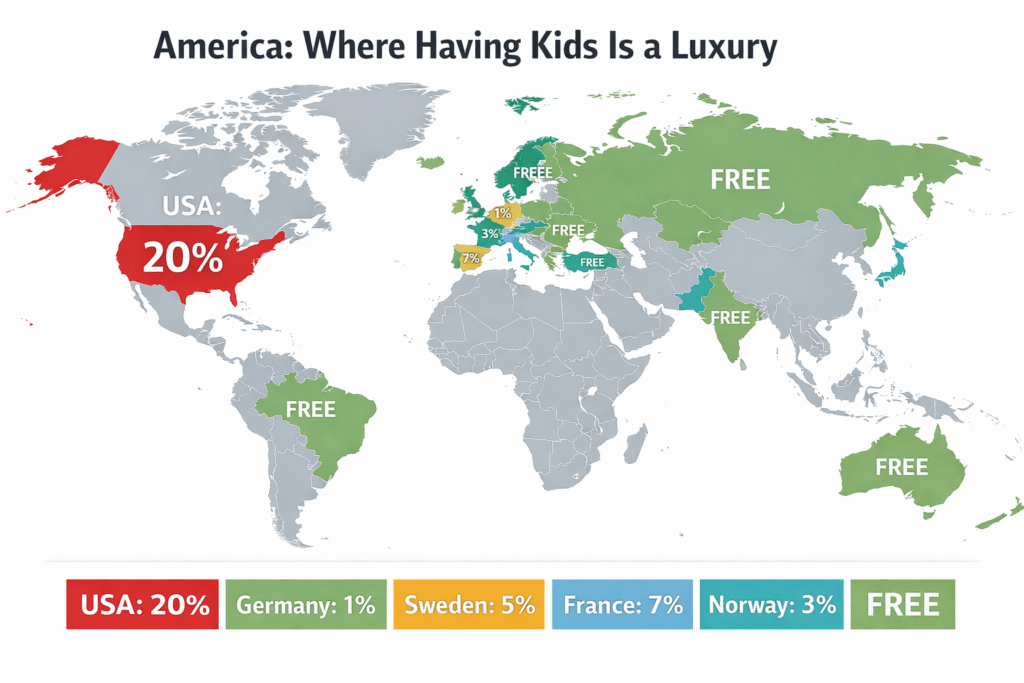
| Childcare | $22,200/year (20% of income) | ~1% of income |
| University | $11,950/year (up 148% since 1980) | Free |
| Paid vacation | 0 days guaranteed | 30 days |
| Parental leave | Varies, often unpaid | 14 weeks fully paid |
| Sick days | Limited | Unlimited |
The US spends $14,885 per person on healthcare—more than double what comparable nations spend. And we get worse outcomes: lower life expectancy, higher infant mortality.
We pay twice as much for worse results.
Childcare Costs: America vs. The World
Who Actually Benefits?
Wealth Concentration
- Top 1% holds 30.8% of all wealth ($49.2 trillion)
- Bottom 50% holds 2.8%
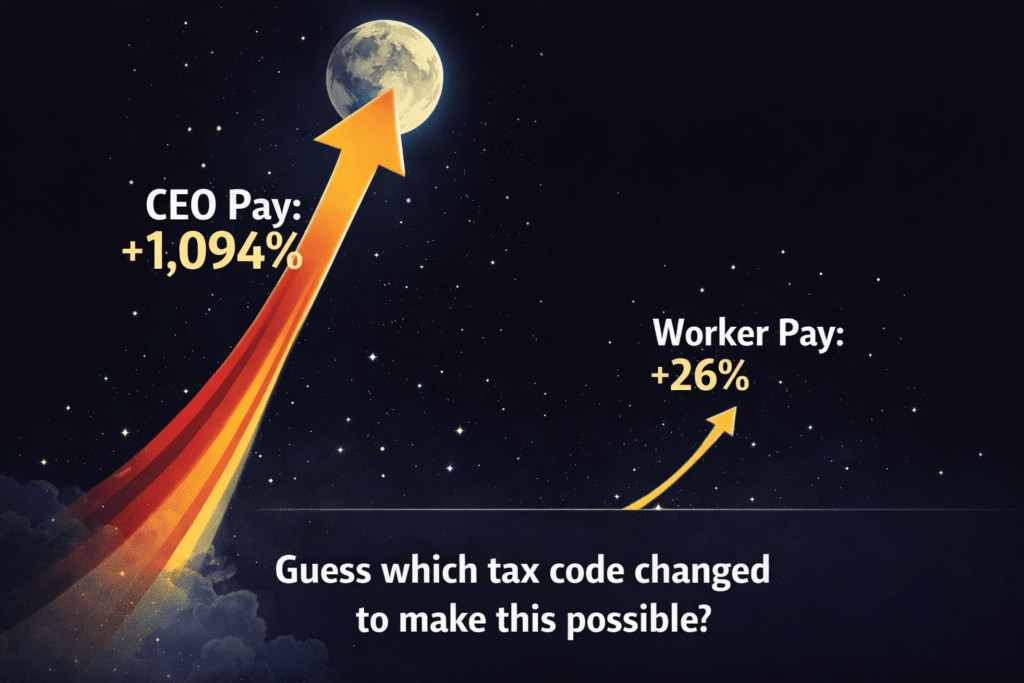
CEO vs. Worker Pay
- CEO pay grew 1,094% since 1978
- Worker pay grew 26%
- CEO-to-worker ratio: 281:1 (up from 21:1)
CEO Pay Growth vs. Worker Pay Growth (Since 1978)
What Billionaires Actually Pay
ProPublica found that the 25 wealthiest Americans paid a true tax rate of 3.4% on their wealth gains between 2014-2018.
- Warren Buffett: 0.1%
- Jeff Bezos: 0% (2007 and 2011)
- Elon Musk: 0% (2018)
This is legal. This is the system working as designed.
Where Corporate Tax Cuts Go
S&P 500 companies spent $1.6 trillion on stock buybacks and dividends in 2024—triple the total income of the poorest 27 million US households.
They’re not using tax cuts to invest or create jobs. They’re inflating stock prices for shareholders, 75% of whom are in the top 1%.
The American Dream Is Mathematically Impossible
Here’s what this looks like for real families:
- Median household retirement savings: $87,000 total
- Workers under 35: $5,400 saved for retirement
- Nearly half of middle-class workers expect to work past 65
- 15% don’t plan to retire at all
- Student debt pushed median first-time home buyer age to 40 (up from 29 in 1980)
- Gen Z homeownership rate: just 26%
- Housing costs: 5.0x median income (up from 2.9x in 1980)
The American Dream isn’t deferred anymore. It’s mathematically impossible.
December: Back at the Kitchen Table

The Andersons survived the year. Barely.
They’re still paying off the air conditioner and the braces. The credit card balance from the tires is still accruing interest. Their savings account has $943 in it.
The “good” news:
- Mike got a 3% raise: +$1,440/year (+$120/month)
The bad news:
- Health insurance premiums increasing 6%: +$824/year (+$69/month)
- Daycare going up: +$75/month
Mike’s raise nets them $51/month after the premium increase.
Then daycare eats that and more.
They make more than two-thirds of American households.
And they’re going backwards.
The “Raise” That Disappears
Here’s what you need to understand:
The Andersons aren’t failing at personal finance. The system is designed to extract maximum value from their labor while providing minimal return.
They can’t budget their way out of this. They can’t skip enough lattes or cancel enough streaming services.
The math doesn’t work. It can’t work. It was never supposed to work for them.
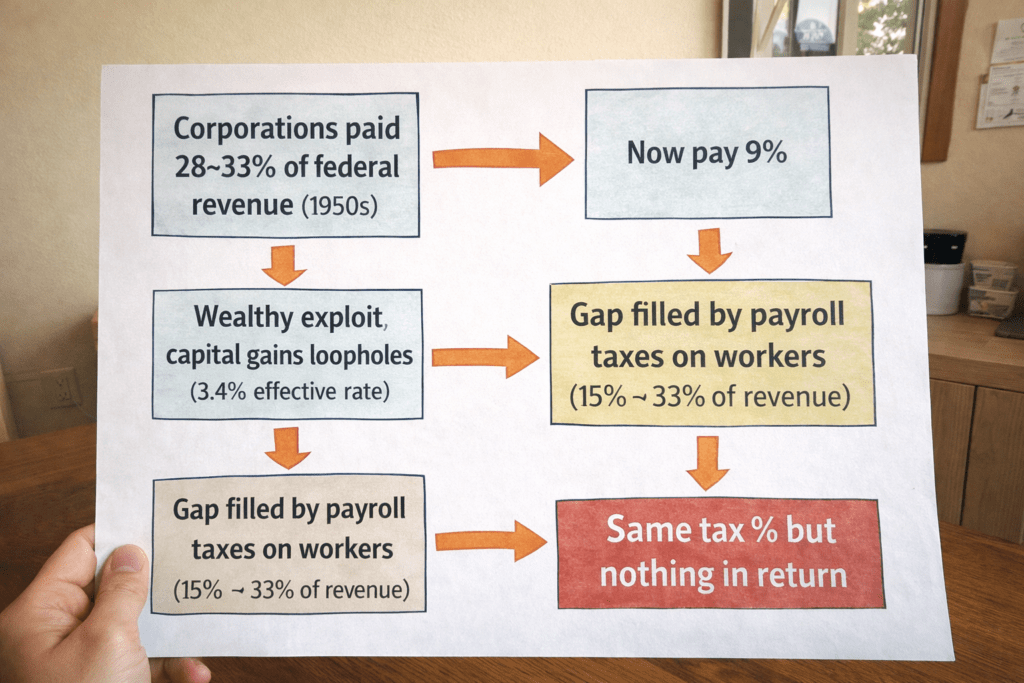
How The Tax Burden Shifted: The 4-Step Process
How the Burden Shifted
The middle class isn’t being taxed more overall—the total burden has stayed near 31% since 1980. But the composition changed:
- Corporations dropped from funding a third of federal revenue to less than a tenth
- The wealthiest Americans exploit a parallel tax code built on capital gains preferences
- The gap was filled by payroll taxes that fall hardest on wage earners
- The costs that taxes should cover—healthcare, education, childcare—were privatized and inflated until total mandatory spending rivals high-tax European countries
Except those countries actually provide services.
The Bottom Line
Next to it:
“Billionaires’ effective tax rate: 3.4%”
“Your effective rate: 56.4%”
Large text: “The system is working exactly as designed.”
The Andersons take home $81,822 after payroll taxes and health premiums. Then childcare consumes another $22,200.
They’re left with $59,622 for mortgage, food, cars, student loans, and everything else a family of four needs.
Meanwhile:
- Billionaires pay 3.4%
- Corporations spend three times more on buybacks than taxes
Someone’s getting rich off this arrangement. It’s just not Mike and Sarah.
What This Means for You
The math isn’t broken. It’s working exactly as intended.
The system was deliberately engineered to look fair on paper while quietly bleeding families like the Andersons dry.
Until enough people understand that this isn’t about making better individual choices—that it’s about a structural system rigged against wage earners—nothing will change.
The Real Problem
So the next time someone tells you that you just need to “budget better” or “work harder,” remember:
- Corporations went from 28% of federal revenue to 9%
- Billionaires pay 3.4% while families like the Andersons pay 56% when you count everything
- The problem isn’t personal responsibility
The problem is a machine designed to extract everything it can from people who work for a living—while the people who own things pay almost nothing.
And it’s running exactly the way it was built to run.
Summary: By The Numbers
What’s your experience? Does this match your reality? Share your story in the comments below.